Press Briefing
February
19, 2000
Advanced
Geomagnetic Storm Forecasting
Capabilities
Developed for the
Electric
Power Industry
John
Kappenman,
Metatech Corporation
Overview
Solar
Cycle 23 is forecast to be a major solar cycle
Large
Geomagnetic Storms are likely to occur over the next few years
Geomagnetic Storm activity can occur for as much as 20% of the year during this cycle
Large
Storms can erupt on a Planetary level within a few minutes time
Northern
Hemisphere Power Grid infrastructure is exposed to and vulnerable to large
geomagnetic storms
United
Kingdom's
National Grid Company has implemented extensive preparations for Geomagnetic
Storm Activity and will be an important industry proving ground for this
advanced forecasting technology
High-Quality
Geomagnetic Storm Forecasting Services are available that provide detailed
minute-by-minute storm notification and power-system operator display information,
with a typical 45 Minute Lead-Time
Power
Grids & Space Weather Background
Society
reliance on electricity for meeting essential needs has steadily increased
for many years. This unique energy service requires coordination of electrical
supply, demand, and deliveryall occurring at the speed of light.
Disturbances
caused by solar activity can disrupt these complex power grids. When the
Earth's magnetic field captures ionized particles carried by the solar
wind, Geomagnetically-induced currents (GIC) can flow through the power
system, entering and exiting the many grounding points on a transmission
network. GICs are produced when shocks resulting from sudden and severe
magnetic storms subject portions of the Earth's surface to fluctuations
in the planet's normally stable magnetic field. These fluctuations induce
electric fields in the Earth that create potential differences in voltage
between grounding pointswhich causes GICs to flow through transformers,
power system lines, and grounding points. Only a few amps are needed to
disrupt transformer operation, but over 200 amps have been measured in
the grounding connections of transformers in affected areas.
Unlike
threats due to ordinary weather, Space Weather can readily create large-scale
problems because the footprint of a storm can extend across a continent.
As
a result, simultaneous widespread stress occurs across a power grid to
the point where widespread failures and even regional blackouts may occur.
Systems
in the upper latitudes of
the Northern
Hemisphere are at increased risk because Auroral activity and its effects
center on the magnetic poles.
North
America is particularly exposed to these storm events because the Earths
magnetic north pole tilts toward this region and therefore brings it closer
to the dense critical power grid infrastructure across the continent. (Figure
1- Exposed Regions of the Northern Hemisphere)
Lessons
Learned from Solar Cycle 22
The
rest of the North American system also reeled from this storm.
Over
the course of the next 24 hours, five more large disturbances propagated
across the continent, the only difference being that they extended much
further south and very nearly toppled power systems from the Midwest to
the Mid-Atlantic Regions of the US.
The NERC, in their post analysis, attributed over 200 significant anomalies
across the continent to this one storm.
In
spite of the considerable events that were observed, it is now recognized
that North America was very lucky that day.
This
same storm produced surges twice as intense over the lower Baltic, than
any that were experienced in North America.
But
for the providence of that accident of timing, North American power system
operators likely avoided even larger-scale failures. Over the next 5 years,
smaller storms demonstrated time and again for the power industry that
significant impacts could be triggered at even lower storm levels.
For
perspective, the limited climatologic data available suggests that storms
of even larger intensity and with a larger planetary footprint are possible
than the one that occurred in March 1989.Also,
the power industry realizes that its vulnerability continues to incrementally
grow over time. As a result, the challenges of this solar cycle may be
even greater than those posed 10 years ago.
This
is not an easy problem to analyze and will not be easy to solve.
Only
now, are methods being developed and adopted by the industry to better
manage this risk.
Advanced
Geomagnetic Storm Forecasting
In
the long run, improvements in forecasts will play an important role in
managing these risks. Utility companies concerned about storms, rely on
contingency strategies for weathering severe magnetic disturbances.
Choosing
the best contingency procedures depends on being able to predict storm
severity and how it affects the local system.
NASA
and NOAA have put in place important real-time solar wind monitoring with
the ACE Satellite, which has been operational since January 1998.This
capability allows, for the first time, the ability to accurately predict
the occurrence of large threatening storms with enough lead-time to take
meaningful well-informed actions to better prepare the power grid for the
impact of the storm.
The
first of these advanced forecast systems has been developed by Metatech
and is now operational at National Grid Company, the utility that provides
service to England and Wales.
National
Grid is the largest electric transmission operating company in the world
and is providing the vital proving ground for this advance in Space Weather
forecasting for the power industry. This forecasting capability has been
operational at National Grid since May of 1999 as a Phase 1 system and
in a fully complete mode of operation since January 31, 2000.Similar
forecast systems may soon be adapted by Metatech for application in other
critical infrastructures that may be impacted by severe Space Weather as
well.
Methods
of classifying geomagnetic storm activity in the past have typically used
two letter indices (for example K1 to K9 for the smallest to largest
geomagnetic storm) to rank the severity of the storm over broad three-hour
time windows and planetary or large region locations.
Space
Weather is a very complex, detailed, and dynamic process that is ever-changing
over the course of the storm.
Just
as the diversity of terrestrial weather impacts to critical operational
infrastructure (such as rain/snow, thunderstorms, heat/cold, hurricanes,
etc.) cannot be adequately classified by 3-hour, 2-letter, planetary
indices; neither should the inherently dynamic impacts of space weather
remain with this outdated classification approach.
The
operation of critical infrastructures such as power grids is a continuous
minute by minute coordinated and supervised operation.
Thus,
the forecasting capability for geomagnetic activity also needs to provide
continuous updates of the rapidly changing space environment conditions
to best meet the operational needs of power systems in managing this storm
risk.
Defining
New Standards for Forecast Capability
 |
|
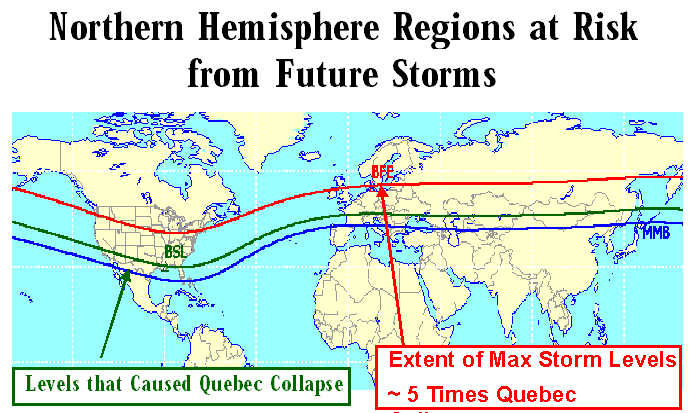
Figure
1: Exposed Regions of the Northern Hemisphere. The footprints
of a superstorm can be extensive, the above diagram shows the regions of
the Northern Hemisphere that can be exposed to intense storm activity such
as the Great Geomagnetic Storm of March 1989. For perspective, the level
of storm severity that precipitated the Hydro Quebec collapse was observed
at locations as far south as those depicted by the green contour line,
which would encompass most of North America and Europe (as shown in green).
Much stronger intensities were observed at more northerly locations (as
outlined in red), these intensities are approximately 5 times more severe
than the levels that triggered the Hydro Quebec collapse. Levels of one-half
the intensity of those that triggered the Hydro Quebec collapse have also
shown to be capable of causing power reliability problems, which for this
storm extended to even lower latitudes (as shown in blue).
|
The
advanced and comprehensive forecast technologies now employed provide power
system operators with a clear and to-the-point summary of Space Weather
conditions, similar to the way we see ordinary weather information, such
as radar and satellite imagery. (Figure 3 Detailed Ground Level Impact
Areas are Forecast)
As depicted
in Figure 3, this system assesses the environment created by the storm
in detail.
An even more important
feature of this forecast system is provided by the ability to assess the
storms impact on the power grid.
A
detailed model of the power grid is calculated to provide a quantifiable
assessment for the system operator of the potential impact on a short-term
basis to enable well-informed judgments about appropriate operational response
measures. (Figure 4 Detailed Power Grid Model Display)
Space
Weather forecasting is more difficult than ordinary weather forecasting.
Because
of the inherent dynamic nature of storms, forecasting models like this
need to be continuously updated.
Magnetospheric,
ionospheric and power grid models all need to be continuously re-calculated
by data provided by a solar wind monitoring satellite located one-million
miles upstream of the Earth. This data provides the lead-time, because
it takes another 45 minutes to one-hour typically for the solar wind to
arrive at the Earth.
The solar wind
data updates are then provided to the models for recalculation of space
weather forecasts on a continuous one-minute cadence.
The
enormous US power network is controlled regionally by more than 100 separate
control centers that coordinate responsibilities jointly for the impacts
upon real-time network operations.
Other
power networks around the world use similar regional control center approaches
for providing the 24-hour continuously supervised operation of their networks.
Not one of these large power system control centers would do without continuous
high quality weather data in managing the operation of their systems.
The
same paradigm needs to be developed and adopted by the power industry for
the threats posed by Space Weather.
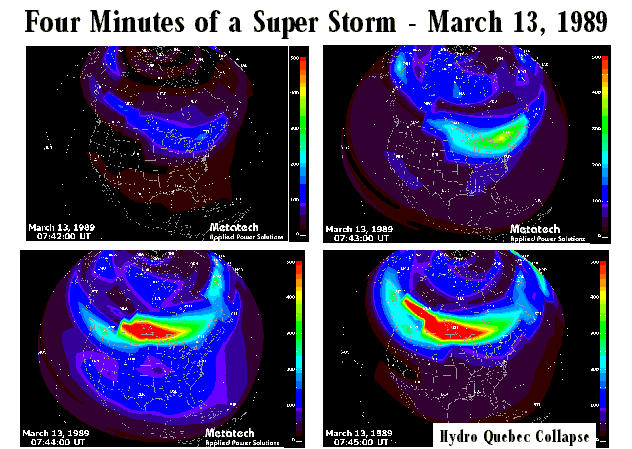 |
| Figure 2: Four Minutes of a Superstorm. Space weather conditions capable of threatening power system reliability can rapidly evolve. The system operators at Hydro Quebec and other power system operators across North America faced such conditions during the March 13, 1989 superstorm. The above slides show the rapid development and movement of a large geomagnetic field disturbance between the times 7:42 - 7:45 UT ( 2:42 - 2:45 EST ) on March 13,1989. The disturbance of the magnetic field began intensifying over the Eastern US-Canada border and then rapidly intensified while moving to the west across North America over the span of a few minutes. From calm conditions, the Hydro Quebec system collapse took only an elapse time of 90 seconds to occur during this storm. Without better forecast warnings, sudden storm events provide essentially no time for meaningful human intervention. The magnetic field disturbances observed at the ground are caused by large electrical currents (electrojet currents) located in the ionosphere at 100 km altitude that interact with the Earth's magnetic field. The electrojet currents act much like the high altitude wind patterns associated with the jet stream that transport and shape the ordinary or terrestrial weather patterns. With Space weather, the speed and the size of these patterns can develop extremely fast and on a planetary scale. The large ionospheric (electrojet) currents that created these magnetic field disturbances, as shown in the above slides, moved from Eastern Canada to Alaska in less than 8 minutes, a velocity exceeding 1000 km/min. |
 |
|
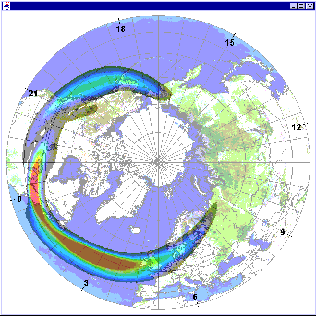
Figure 3: Detailed Ground Level Impact Areas are Forecast. The above shows the Northern Hemisphere display of the forecast impact areas due to a geomagnetic storm. As shown above, a large impact area extends from approximately Canada to Western Europe.. This model uses real-time solar wind data from the NASA ACE satellite to forecast the expected storm conditions both for the United Kingdom region and worldwide. The model provides important details on the storm intensity, the equator-ward boundaries and temporal variations of the electrojet currents in the ionosphere that are used to estimate ground-level magnetic field disturbances and impacts to critical infrastructures. The estimate is made nominally 45 minutes in advance, which allows important lead-time for impacted systems. Because large-scale changes can occur rapidly, this model recalculates the electrojet current continuously at a one-minute intervals. |
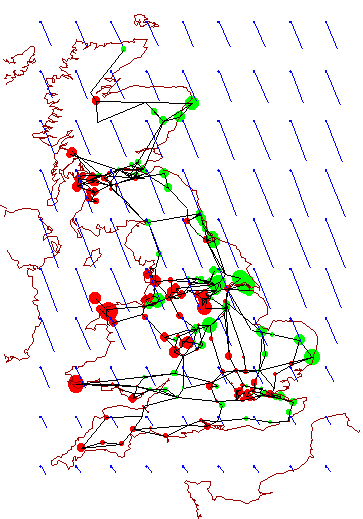 |
| Figure 4: Power Grid Model. The storm visualization shown above is designed to provide a clear and concise picture of the location and intensity of storm impacts across the transmission network. In this example, the storm conditions are displayed for National Grid over England and Scotland. The 400kV and 275kV transmission system is displayed with small circles indicating the magnitude (circle size varies) and polarity (circle color changes) of the GIC (ground Induced current) at each transformer. Also shown are the vector icons of the magnitude and direction of the local magnetic field during the storm, which is responsible for the GIC flows. Text and graphic summaries can also be provided on System or Region reactive power demands, numbers of transformers in saturation and other important system impact details. This PowerCast calculation is made in a Forecast and Nowcast mode and both are recalculated at one-minute intervals. The Forecast mode utilizes data from the electrojet model output of SpaceCast and effectively provides a nominal 45 minute warning of storm impacts. The Nowcast mode utilizes locally sensed magnetic field data and provides a system-wide assessment of current conditions. |
(Return to Metatech Main Menu)